Business question
Sales information from multiple views needed to be consolidated into a tool that supported both rapid monitoring and deeper investigation.
Sales analytics
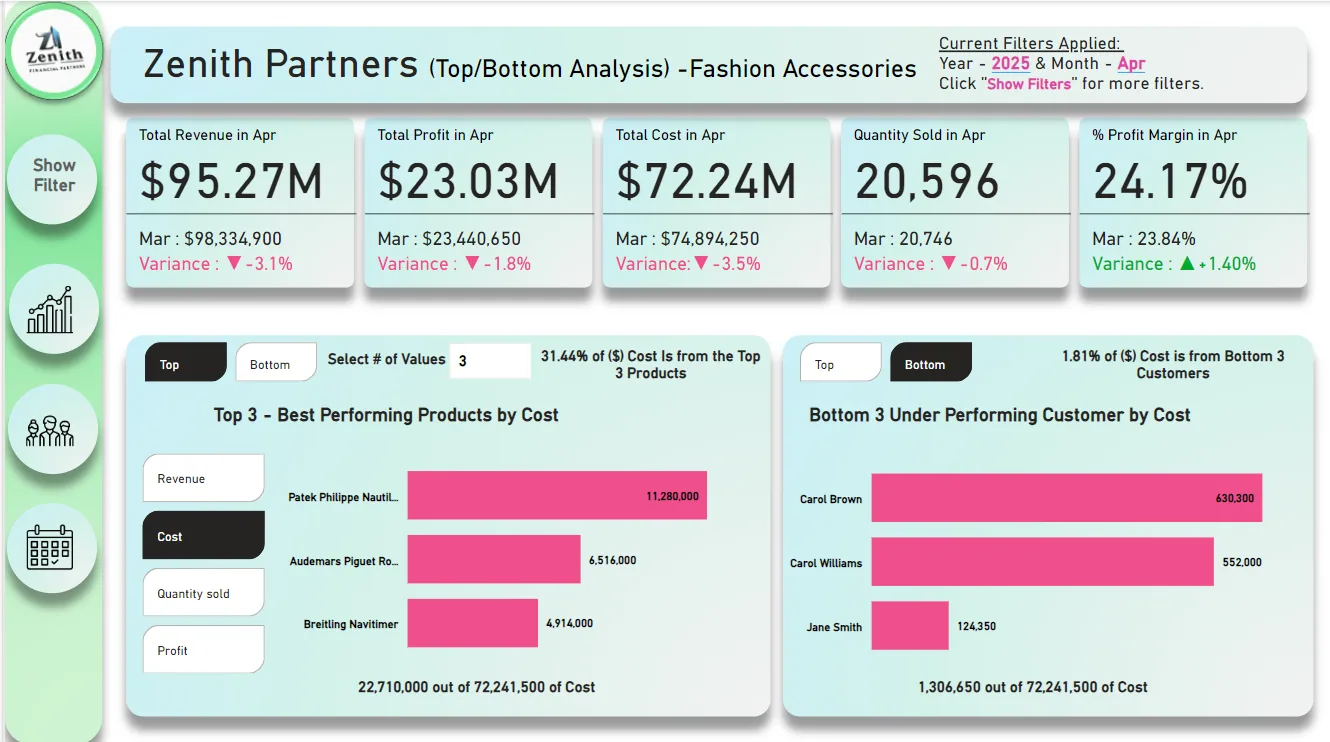
A structured sales dashboard built around the Monitor, Analyze, Detail framework for fashion-accessory performance.
The brief
Sales information from multiple views needed to be consolidated into a tool that supported both rapid monitoring and deeper investigation.
Figures below describe the displayed portfolio dataset, not a client outcome.
Analysis walkthrough
The static showcase is organized as a three-step route from a fast management read to the detail needed for a commercial follow-up.
Start with headline KPIs, period movement and the first signal that deserves attention.
Compare regions, teams, products and time periods to understand what is behind the movement.
Trace the signal to transaction-level context so the next action is grounded in evidence.
Dashboard views
Select a view to inspect the analysis and the management question it is designed to support.
A structured sales dashboard built around the Monitor, Analyze, Detail framework for fashion-accessory performance.
Start a conversation
Share the decision you need to support and the data or report you already have.
Next case study
Public-data analysisCO₂ & Socioeconomic Drivers →
→