Questions first
Clarify the audience, review cadence and actions the dashboard needs to support.
Financial dashboards
Power BI dashboards that connect financial, commercial and operational measures to the management questions behind them.
Dashboard engagement
The work starts with the decision, then defines the measures, data flow and drill-through needed to support it.
Clarify the audience, review cadence and actions the dashboard needs to support.
Document KPI definitions, calculation logic, source ownership and filters.
Deliver the Power BI view, drill-through paths and handover notes needed for repeat use.
Dashboard reel
A concise tour across financial performance, valuation, sales, operational and commercial analytics. Captions are included, so sound is optional.
Dashboard portfolio
Each case study explains the business problem, analytical approach, displayed portfolio evidence and decision supported.
 01View dashboard ↗
Profitability, valuation, customer economics and operating performance brought into one decision-ready view.
Explore case study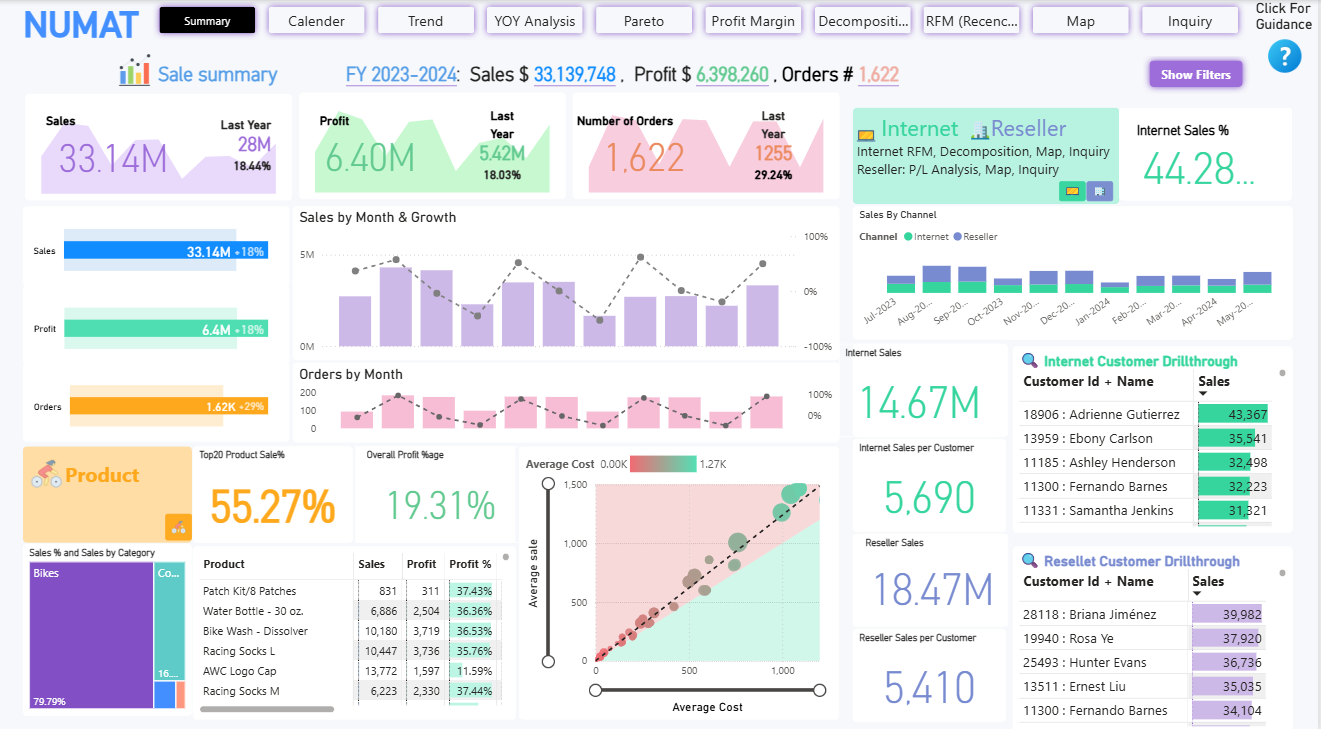 02View dashboard ↗
A commercial view connecting revenue, profitability, products, channels and customers.
Explore case study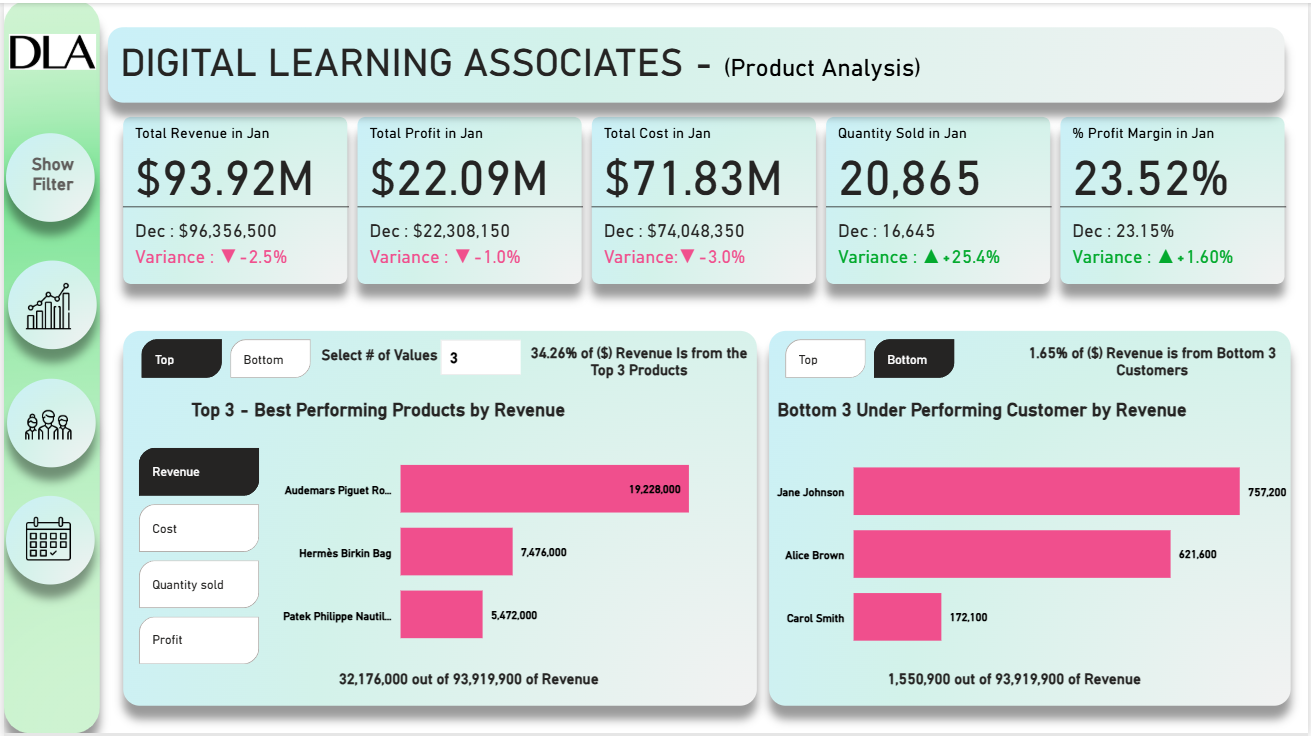 03View dashboard ↗
Revenue, customer analysis and annualized performance connected in one decision-ready dashboard.
Explore case study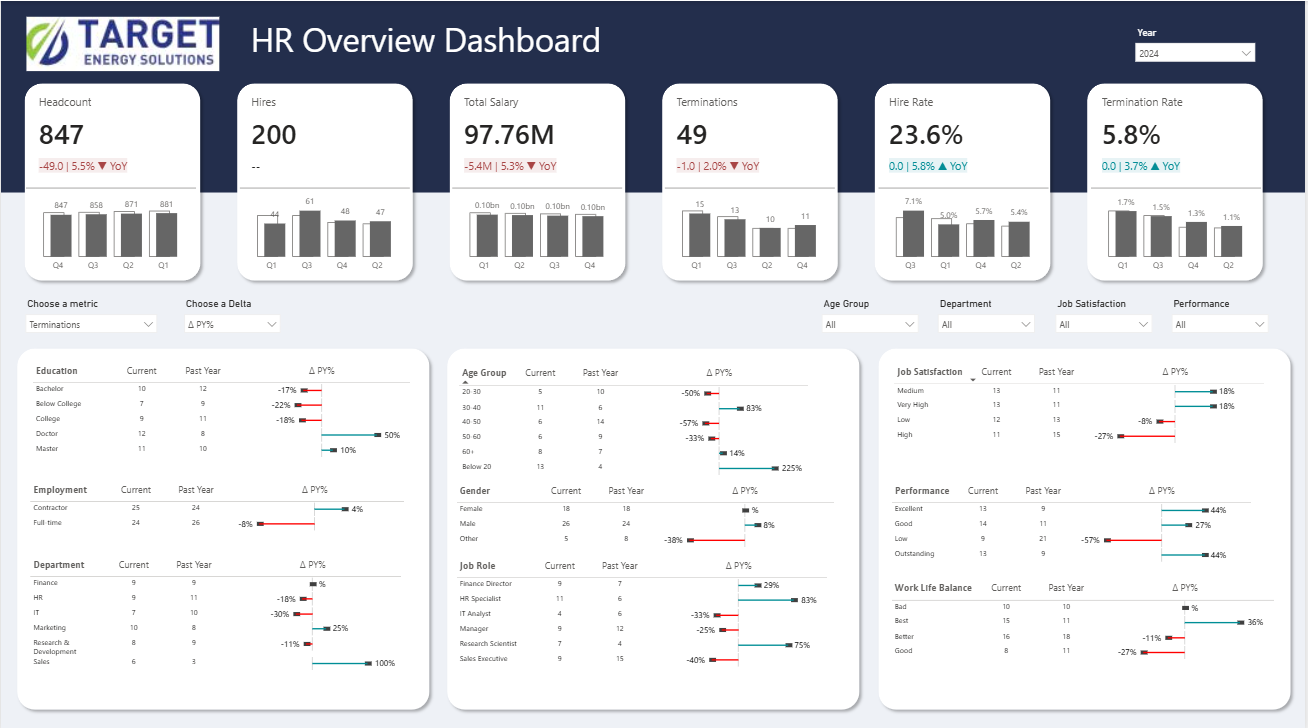 04View dashboard ↗
Workforce trends, attrition signals and people-performance metrics made easier to monitor and act on.
Explore case study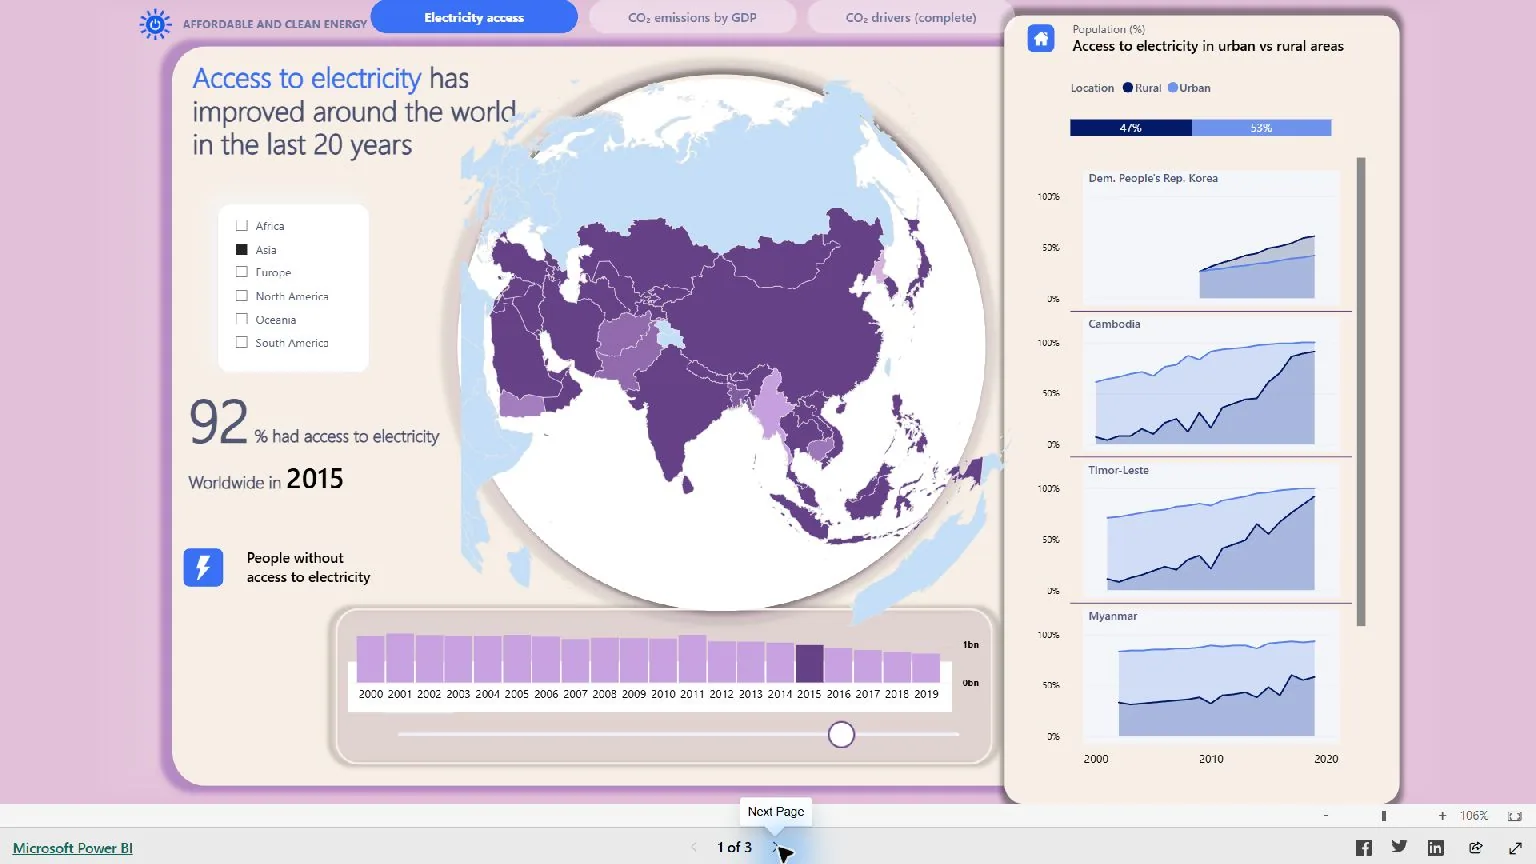 05View dashboard ↗
Twenty years of public indicators connected in a global socioeconomic and environmental story.
Explore case study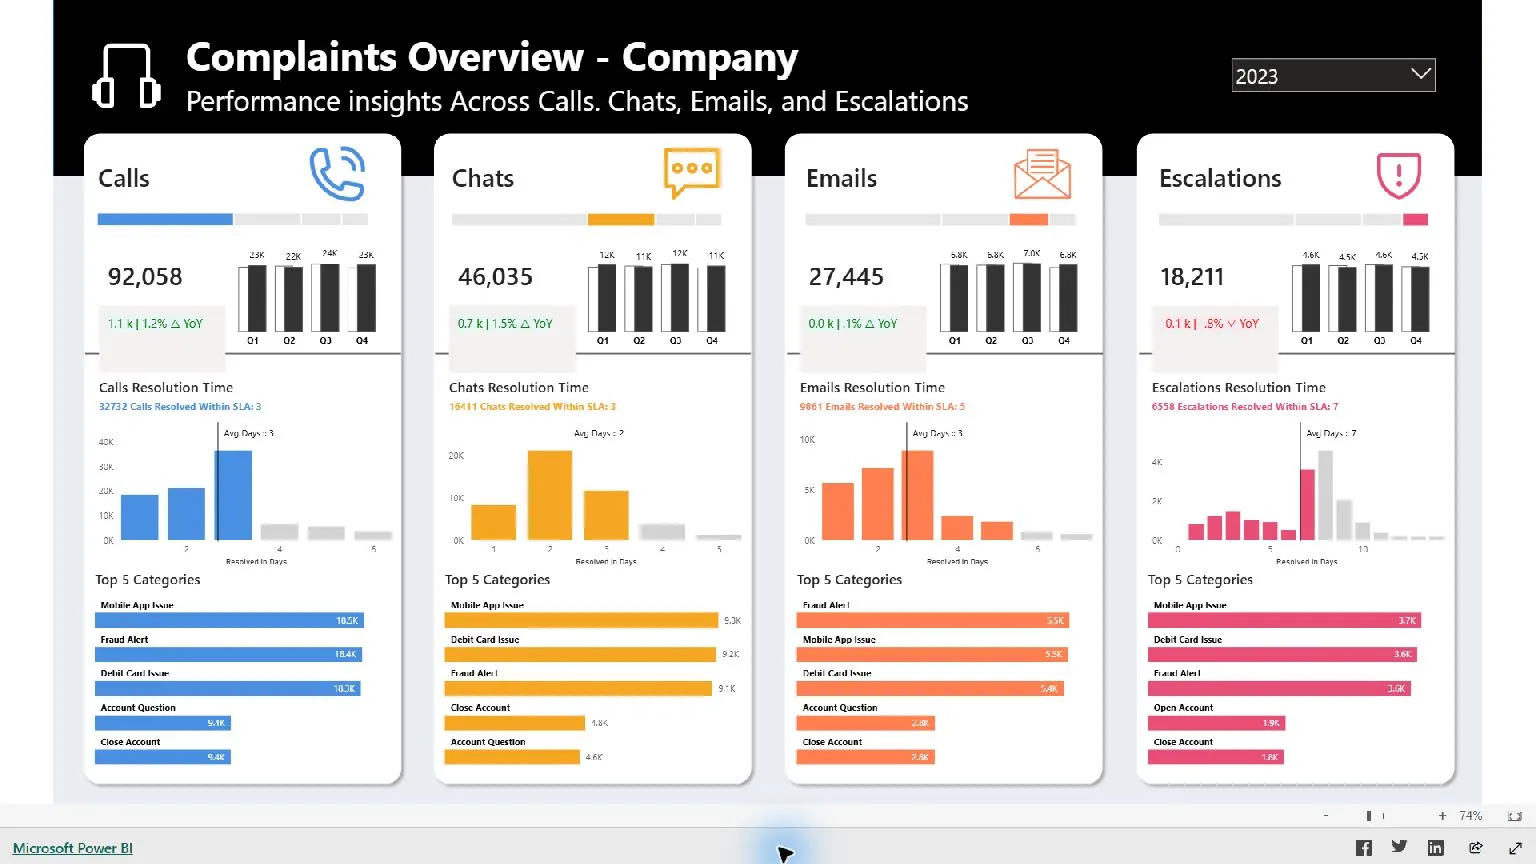 06View dashboard ↗
Calls, chat, email and escalations unified into an operational service-performance view.
Explore case study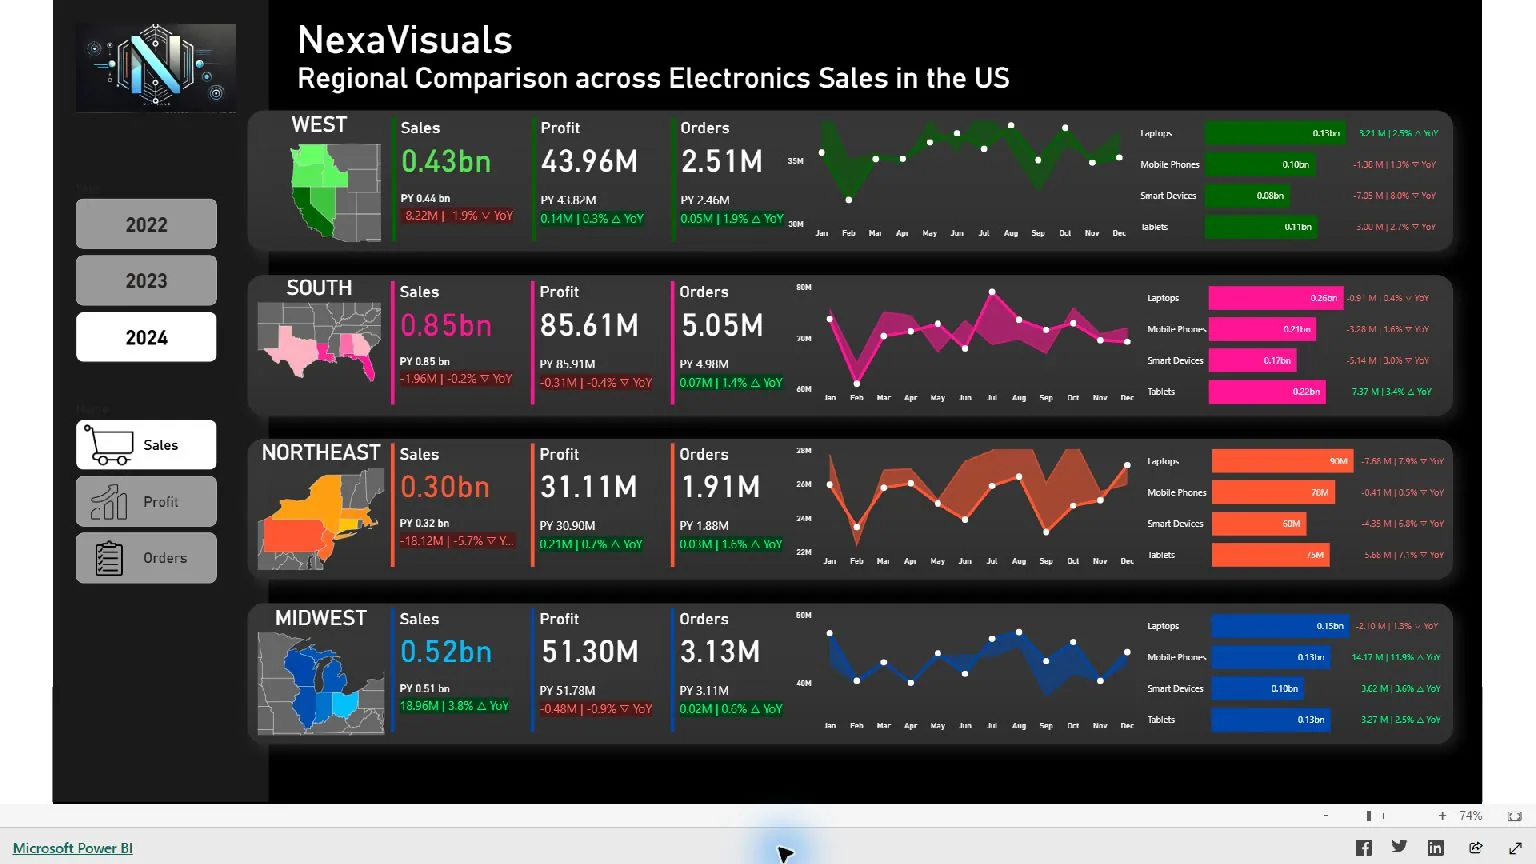 07View dashboard ↗
Regional sales, profit and order performance presented through a sharp executive interface.
Explore case study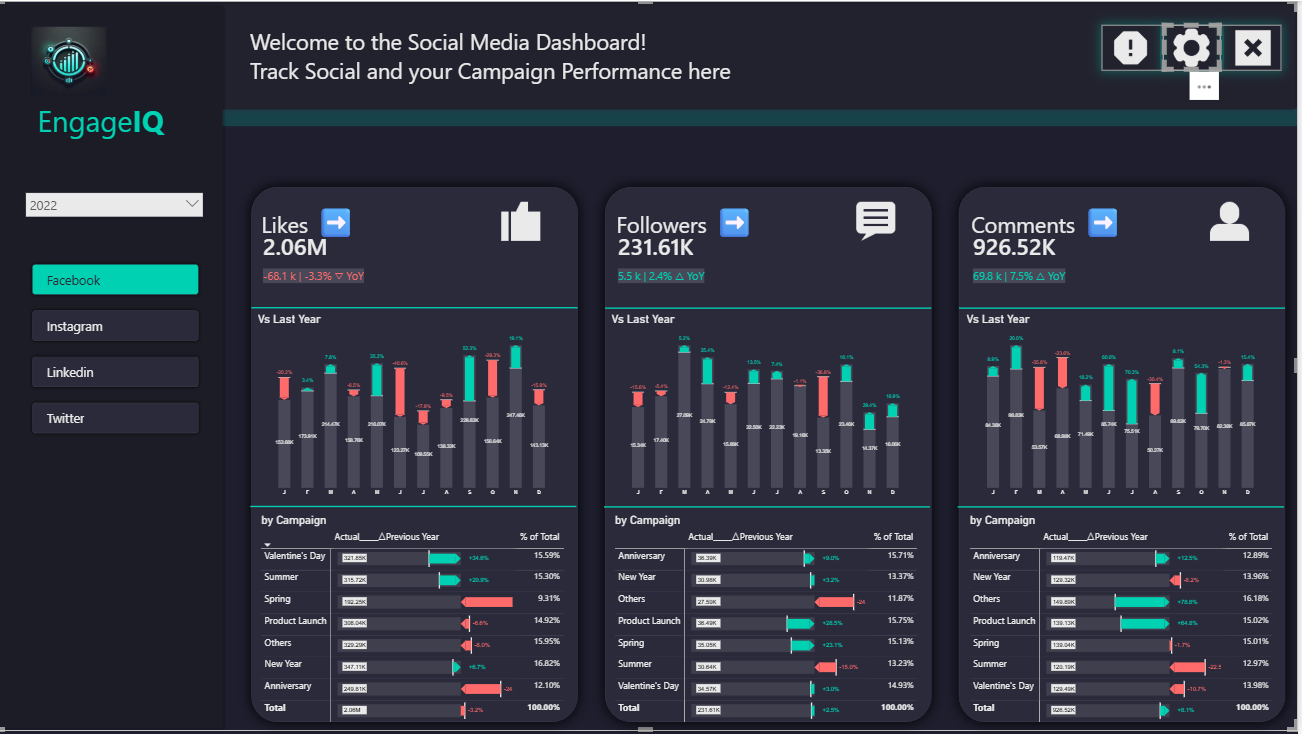 08View dashboard ↗
A unified view of audience growth, engagement trends and campaign performance.
Explore case studyTypical starting point
A useful first review includes a sample export, the existing KPI list, the reporting audience and the date of the next management review.
Agree the business questions, measures, owners and reporting cadence.
Structure the data model and design the executive and drill-through views.
Test the output, document definitions and prepare the team to use it.
Start a conversation
Share the current report, the data available and the decision the dashboard needs to support.