Business question
Digital Learning Associates needed a connected view of sales performance, customer behavior, forecasting and annualized trends to support more confident commercial decisions.
Sales & customer analytics
A multi-view sales and customer analytics dashboard for revenue performance, forecasting, product contribution and buyer behavior.
The brief
Digital Learning Associates needed a connected view of sales performance, customer behavior, forecasting and annualized trends to support more confident commercial decisions.
Figures below describe the displayed portfolio dataset, not a client outcome.
The transformation
The Digital Learning Associates dashboard connects forecasting, revenue performance, customer behavior and annualized trends into one operating view.
Interactive report
Use the report controls to navigate pages, filter the data and inspect individual views.
The interactive report is best viewed in a larger window.
Open interactive report (opens in a new tab)Public portfolio report. The demonstration data is intentionally non-confidential.
Open report in a new tab (opens in a new tab)Analysis walkthrough
The showcase moves from headline sales performance to customer context and annualized patterns so each signal has a clear next view.
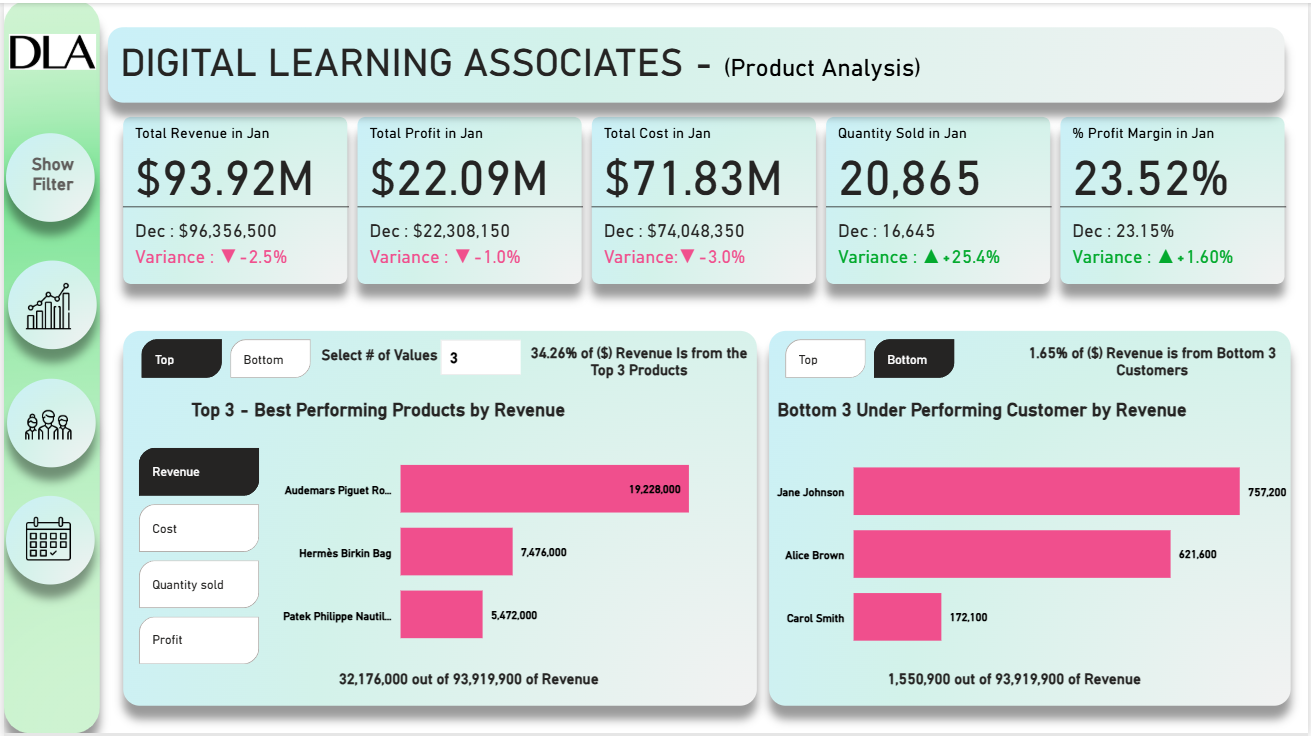
Start with revenue, profit, cost, margin and product performance for the selected period.
Compare buyer type, country, age group and customer contribution to understand what drives demand.
Trace the signal across quarters, years, months and weekdays to support planning and follow-up action.
Dashboard views
Select a view to inspect the analysis and the management question it is designed to support.
January revenue, profit, cost, quantity and margin compared with the prior month, with top products and underperforming customers.
Start a conversation
Share the decision you need to support and the data or report you already have.
Work
Browse the complete portfolio of dashboards, models and reporting work. Choose another case study without leaving this page.
 01
01 02
02 0304
0304 05
05 06
06 07
07 08
08 09
09 10
10Use the arrows or swipe to browse the full case-study library.