Business question
Complaint information across calls, chats, emails and escalations needed a shared operational view and consistent performance definitions.
Operational analytics
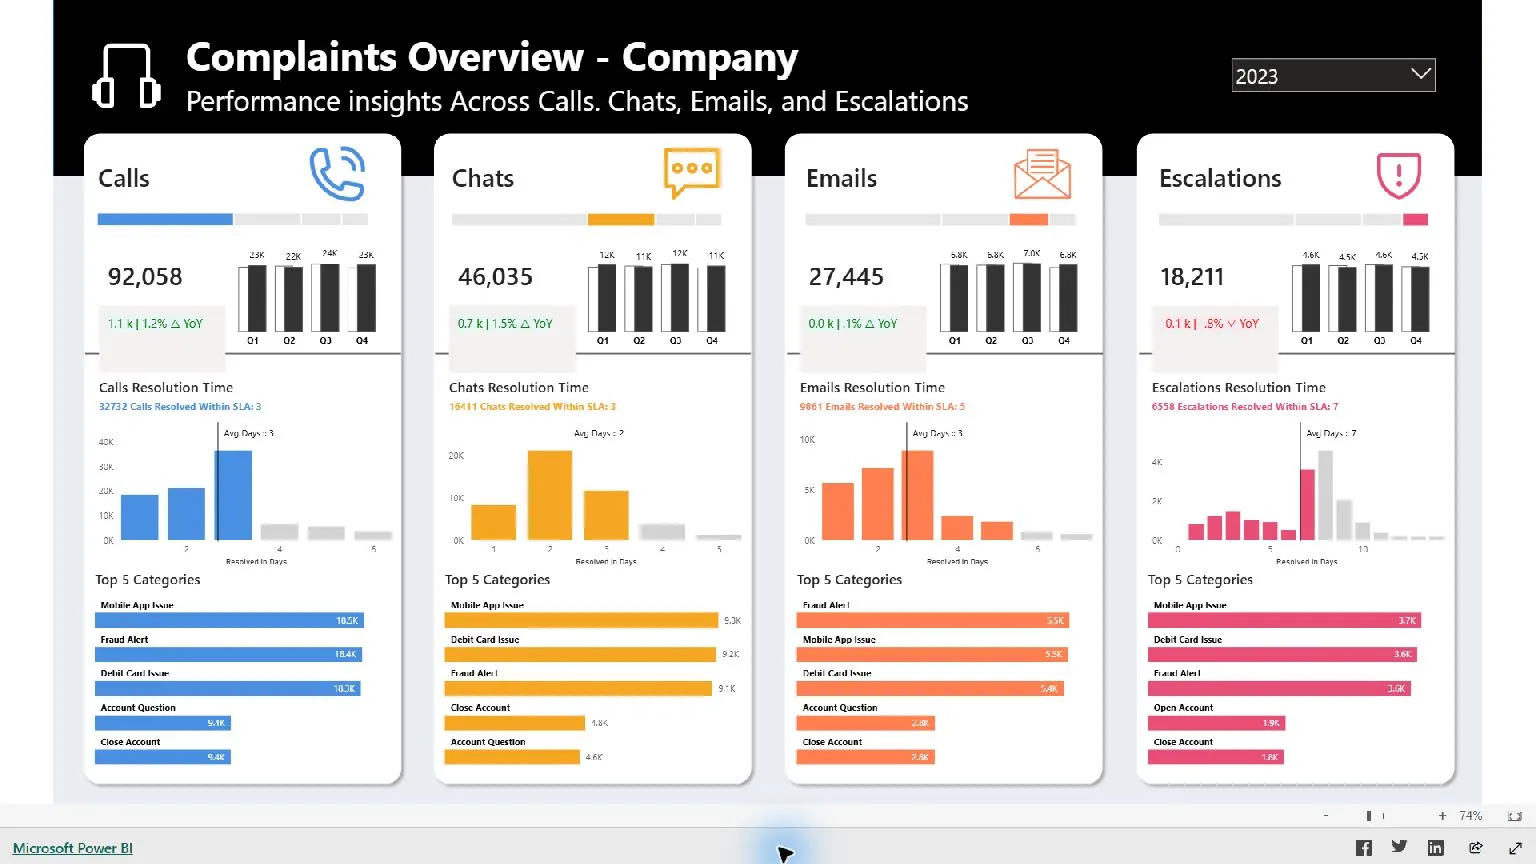
A cross-channel service dashboard for complaint volumes, resolution times, SLA adherence and issue categories.
The brief
Complaint information across calls, chats, emails and escalations needed a shared operational view and consistent performance definitions.
Figures below describe the displayed portfolio dataset, not a client outcome.
Interactive report
Use the report controls to navigate pages, filter the data and inspect individual views.
The interactive report is best viewed in a larger window.
Open interactive report (opens in a new tab)Public portfolio report. The demonstration data is intentionally non-confidential.
Open report in a new tab (opens in a new tab)Dashboard views
Select a view to inspect the analysis and the management question it is designed to support.
Calls, chats, emails and escalations compared by volume, resolution time and leading complaint categories.
Start a conversation
Share the decision you need to support and the data or report you already have.
Work
Browse the complete portfolio of dashboards, models and reporting work. Choose another case study without leaving this page.
 01
01 02
02 03
03 04
04 05
05 06
06 0708
0708 09
09 10
10Use the arrows or swipe to browse the full case-study library.